
Lottery Reconciliation System
Mass Ave Wine Inc.’s manual lottery reconciliation process had become unsustainable as their retail operations expanded. Increasing errors and discrepancies were forcing store supervisors to spend additional time manually tracing shift-level issues.
This case study documents how I designed a reconciliation system shaped through stakeholder interviews, contextual inquiry, workflow mapping, rapid prototyping, usability feedback, and developer feasibility checks.
At a Glance
- Sector
- Retail Operations
- Challenge
- Manual reconciliation caused errors and discrepancies, pushing store staff into overtime.
- My Role
- Led end-to-end UX/UI, partnering with a developer through feasibility, prototyping, testing, and handoff.
- Timeline
- 5 weeks, through handoff to development.
Overcome Inefficient Manual Processes
The goal was to conceptualize and design a solution that streamlined the lottery reconciliation process, reduced manual errors, and gave supervisors actionable insight into shift-level discrepancies.
Our high-level goals were to:
- Equip cashiers with a tool that improved efficiency and minimized errors.
- Give supervisors clear visibility into theft detection and lottery inventory.
- Build a scalable foundation for automation and future POS integration.
Slides below renders the information shared by the client during our first interaction, (before accepting to work on the project) where I tried to understand the problem they are trying to solve.
My Role
I analyzed the manual reconciliation process to uncover inefficiencies and pain points, then ideated concepts to streamline workflows, improve accuracy, and reduce cognitive load for cashiers and supervisors.
I partnered closely with a developer to validate technical feasibility and guide implementation within operational constraints.
Grounded in Reality
My approach was to ground the solution in the real practices of cashiers and supervisors. I captured how reconciliation played out in stores by documenting artifacts, mapping workflows, and identifying the errors and workarounds that kept the process running.
These insights informed the design requirements, which were validated with users and translated into task flows and wireframes, then refined through continuous validation and feasibility checks with the developer.
Given the project’s small scope, I used it to explore practical workflow automations using n8n and a local LLM to speed up synthesis while keeping confidential data processed entirely on-device. I also used Anima and ChatGPT to rapidly generate testable prototypes for user testing.
Understanding the Context
To design a solution which is grounded in solving the problems faced in real practices, I first needed a clear picture of both the industry landscape and the day-to-day realities of reconciliation in stores.
I conducted operational due diligence to understand industry-standard reconciliation practices, existing software solutions, regulatory requirements, and common failure points.
This phase focused on systems, workflows, artifacts, and constraints, not user opinions yet. The outcome was a consolidated reference document that grounded all subsequent UX research and design decisions.
To understand the operational environment, I mapped the physical lottery ecosystem, focusing on how hardware components, printed artifacts, and human interaction intersect during sales and reconciliation.
To ground the work in formal guidance, I compiled reconciliation workflows and requirements from state lottery commissions and industry sources to establish an authoritative baseline.
Using the documented guidance, I translated reconciliation rules into shift-level process maps to expose handoffs, accountability points, and failure-prone transitions.
Existing lottery reconciliation tools were analyzed to identify baseline capabilities, integration patterns, and structural gaps that would later inform feature prioritization.
View the document here.
These insights directly shaped stakeholder interview questions, task analyses, and design focus areas in the subsequent UX research phase.
Stakeholder Interviews
To ensure I capture a range of behaviors, familiarity levels and workarounds, we recruited a representative mix amongst the cashiers (largest amongst the primary user groups), based on the tenure and experience (new hires, mid-tenure, and senior staff). In total, we interviewed:
- 23 cashiers from 18 different stores.
- All four supervisors.
- The owner.
All interviews were conducted over Zoom and recorded. I built an n8n workflow using Whisper CPP to automatically transcribe the recordings with timestamps, then organize the transcripts in structured sheets for analysis. This allowed me to handle a large volume of interviews efficiently.
A structured questionnaire and response tracker were created to consistently capture actions, tools used, and deviations across participants with varying experience levels.
Interview recordings were automatically transcribed with timestamps using a local automation workflow to enable detailed review without manual transcription overhead.
Transcripts were reviewed and distilled into structured spreadsheets, allowing participant responses to be compared systematically across questions and roles.
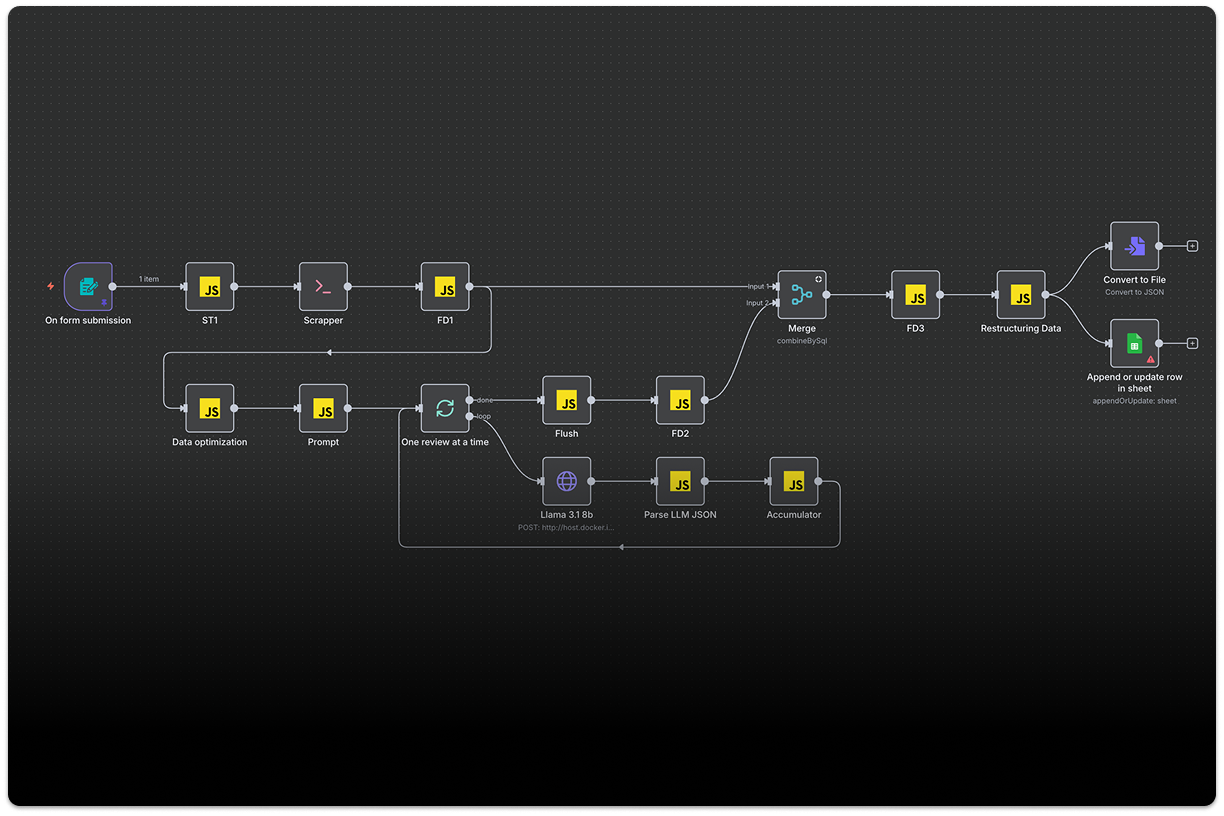
The consolidated responses were processed using a local llm powered n8n-orchestrated clustering workflow to generate an initial set of unsorted and pre-grouped sticky notes, which were then manually reviewed and refined into the final affinity diagram.
Need for Contextual Inquiry
While the interviews revealed high-level pain points and process variations, participants frequently referenced tools, sheets, and informal artifacts that they described verbally but did not share. These artifacts were central to how reconciliation and closing-shift tasks were actually performed. Without them, the workflow narratives felt incomplete.
To bridge this gap, I conducted follow-up contextual inquiry sessions with selected cashiers and supervisors in their real working environments. Observing tasks in context allowed me to move beyond what participants said they did and uncover what actually happened during reconciliation.
To capture practices not fully articulated in interviews, I documented how scratch tickets are handled throughout the day, focusing on in-shift inventory movement and display management.
By preparing the reconciliation report for a live shift, I was able to directly experience the sequence, dependencies, and error risks involved in producing end-of-shift artifacts.
In situations where photography was not permitted, sketches and notes were used to reconstruct cashier behavior, spatial interactions, and reconciliation steps from observation.
To understand cross-store variation, I collected reconciliation artifacts from stores I could not physically visit, including templates and ad-hoc calculation tools.
The collected workflows were consolidated into a single process map, with variations annotated to highlight where and why reconciliation diverges across stores.
This provided the operational detail needed to accurately understand the reconciliation workflow, especially the parts that break down, get improvised, or depend on tacit knowledge.
Insights & Key Problems Identified
As we synthesized the data, a clear pattern emerged across interviews, contextual inquiries, and the artifacts cashiers used daily. While each store had its own routines, the underlying challenges were shared and persistent.
1. High Cognitive Load on Cashiers
Cashiers were juggling between multiple artifacts and doing mental calculations. Discrepancies were only caught at the end of the shift.
2. Workflow Variability Across Stores
Stores didn’t perform the reconciliation the same way. Cashiers developed their own tallying methods. This increased friction and chance of errors.
3. Limited Visibility for Supervisors
Supervisors discovered discrepancies only after reviewing closing reports, Often staying late to manually trace where things had gone wrong.
4. Error-Prone Data Entry
Beginning and ending ticket numbers, counts, and payouts were all entered manually. Cashiers frequently relied on rough approximations.
5. No Centralized Record of Trends
Historical variance data lived in paper logs or personal spreadsheets.
This made it difficult to identify emerging patterns and detect shrinkage.
Addressing What We Discovered
With a clear view of how reconciliation was failing across stores, it became possible to define what a better system must enable, both for cashiers under pressure and for supervisors managing multiple locations.
From Findings to Solution
To keep this case study readable, the following sections present the full ideation and design story for the cashier reconciliation workflow and the interactive report it generates. Other areas of the product are shown briefly through final high-fidelity screens.
Concept Development & Validation
After defining design requirements for each user and stakeholder group, the goal was clear: move quickly from insights to a testable concept.
I explored multiple workflow options through rapid sketches and technical feasibility checks to establish a technically sound baseline, then translated the strongest option into early wireframes and user stories for usability testing.
Rapid concept sketching and task-flow mapping
I created rough, annotated sketches to explore a cashier-friendly reconciliation flow with minimal manual entry. In parallel, I mapped an initial task flow to clarify key steps, decision points, and failure cases.
Early Workflow Concept
I defined the core concept as Scan, Snap, Submit:
- Scan lottery ticket codes (QR or barcode),
- Snap photos of IR34 and SR50 reports to extract required fields,
- Submit after reviewing the calculated totals and captured data.
The experience includes review and confirmation steps, a submission checkpoint, and a report view for validation and export.
Technical Feasibility Study
Scratch tickets, Scanning and OCR options were assessed to determine what could be automated reliably and where manual fallback was required. Key constraints and edge cases were documented, then used to define the prototype scope and interaction patterns.
Developer Alignment
The proposed flow, assumptions, and feasibility findings were reviewed with the full-stack developer and key stakeholders. Alignment was reached on a technically sound v1 to build and validate through usability testing.
Prototype to Refined Workflow
I created early wireframes and user stories to define the screens, behaviors, and edge cases. While most of the reconciliation flow was easy to communicate through the Figma prototype, ticket scanning remained the least trusted part of the experience.
Why the Scanning Flow Needed a Working Prototype
Participants could understand the value of scanning in theory, but during prototype reviews they consistently questioned whether it would work reliably enough in real store conditions to be useful in practice.
Because of that, scanning became the one interaction that needed a more realistic prototype before the workflow could be finalized. I explored several options in Figma, then narrowed them to two directions preferred by both participants and the client.
I exported those frames into HTML using anima plugin, documented the interactions and edge cases, and worked with the ChatGPT to turn them into a device-testable prototype. This allowed both flows to be launched, reset, and compared side by side.
The prototype tested two scanning approaches
One flow kept scanning inside the counting screen as an overlay, while the other one separated scanning into a dedicated camera view followed by a structured review screen with uncounted/counted states, editable quantities, and a final summary step.
Building it closer to a real product made it possible to evaluate not just whether scanning felt realistic, but which interaction gave users more clarity, confidence and control.
Refined Workflow
Testing the working prototype helped validate parts of the experience beyond scanning. It confirmed the importance of visible progress, clearer separation between scanning and review, before submission. It gave them more confidence because progress was easier to track, and manual edits were still possible when needed.
These learnings helped refine not only the scanning feature, but also the surrounding review and completion flow across the application.
Prototype Resources

Final Design
Operational Outcomes
1. Time Saved
Estimated 12–18 minutes saved per closing shift (cashier) and 6–10 hours saved per week due to reduced manual entry.
With the structured review checkpoints in the new system, issues are now flagged immediately, not after the report is submitted.
2. Discrepancies Identified Earlier
Historical supervisor reports logged 11–26 errors per week across 18 stores, typically caught only after closing reports were submitted.
With the structured review checkpoints in the new system, issues are now flagged immediately, not after the report is submitted.
3. Cost Impact
Savings were calculated using hourly rate × time saved × stores, plus a reduction in shrinkage losses from earlier discrepancy detection.
The combined impact came to an estimated $2,500–$4,500 per month across all 18 locations.
Experimental AI Workflows
Two workflow experiments delivered a clear takeaway that local-first, LLM-assisted automations can speed up synthesis, and prototyping.
On-Device Research Acceleration (n8n + Offline LLM):
Built automations to speed synthesis while keeping the data processing entirely on-device, including automated transcription workflows and LLM-assisted clustering as a starting point for affinity mapping.
Design-to-Prototype Pipeline (Anima Plugin + ChatGPT):
Used Anima and ChatGPT to build testable interactive prototypes for usability testing on target devices.
Just as importantly, these experiments established a reusable foundation for building similar local-first workflows based on project requirements.
The related AI workflows are shown in the article below.
 How I Use AI for UX/UI research and design

Up Next
Designing for Trust
Built the evidence base for a winning RFP without user access.
